
Build Reports Into Your Flyte Tasks and See Model Results Live
A weekly roundup of tips, releases, and community news from the flyte.org & union.ai ecosystem.

🚀 Get started with Flyte: docs.flyte.org
💬 Join the community: Slack
🛠️ Make a Contribution: GitHub
📅 Next Event: Agent Loop Hacknight: Build Agents with Flyte (Seattle)
💡 AI engineering tip of the week: Build Reports Into Your Flyte Tasks and See Model Results
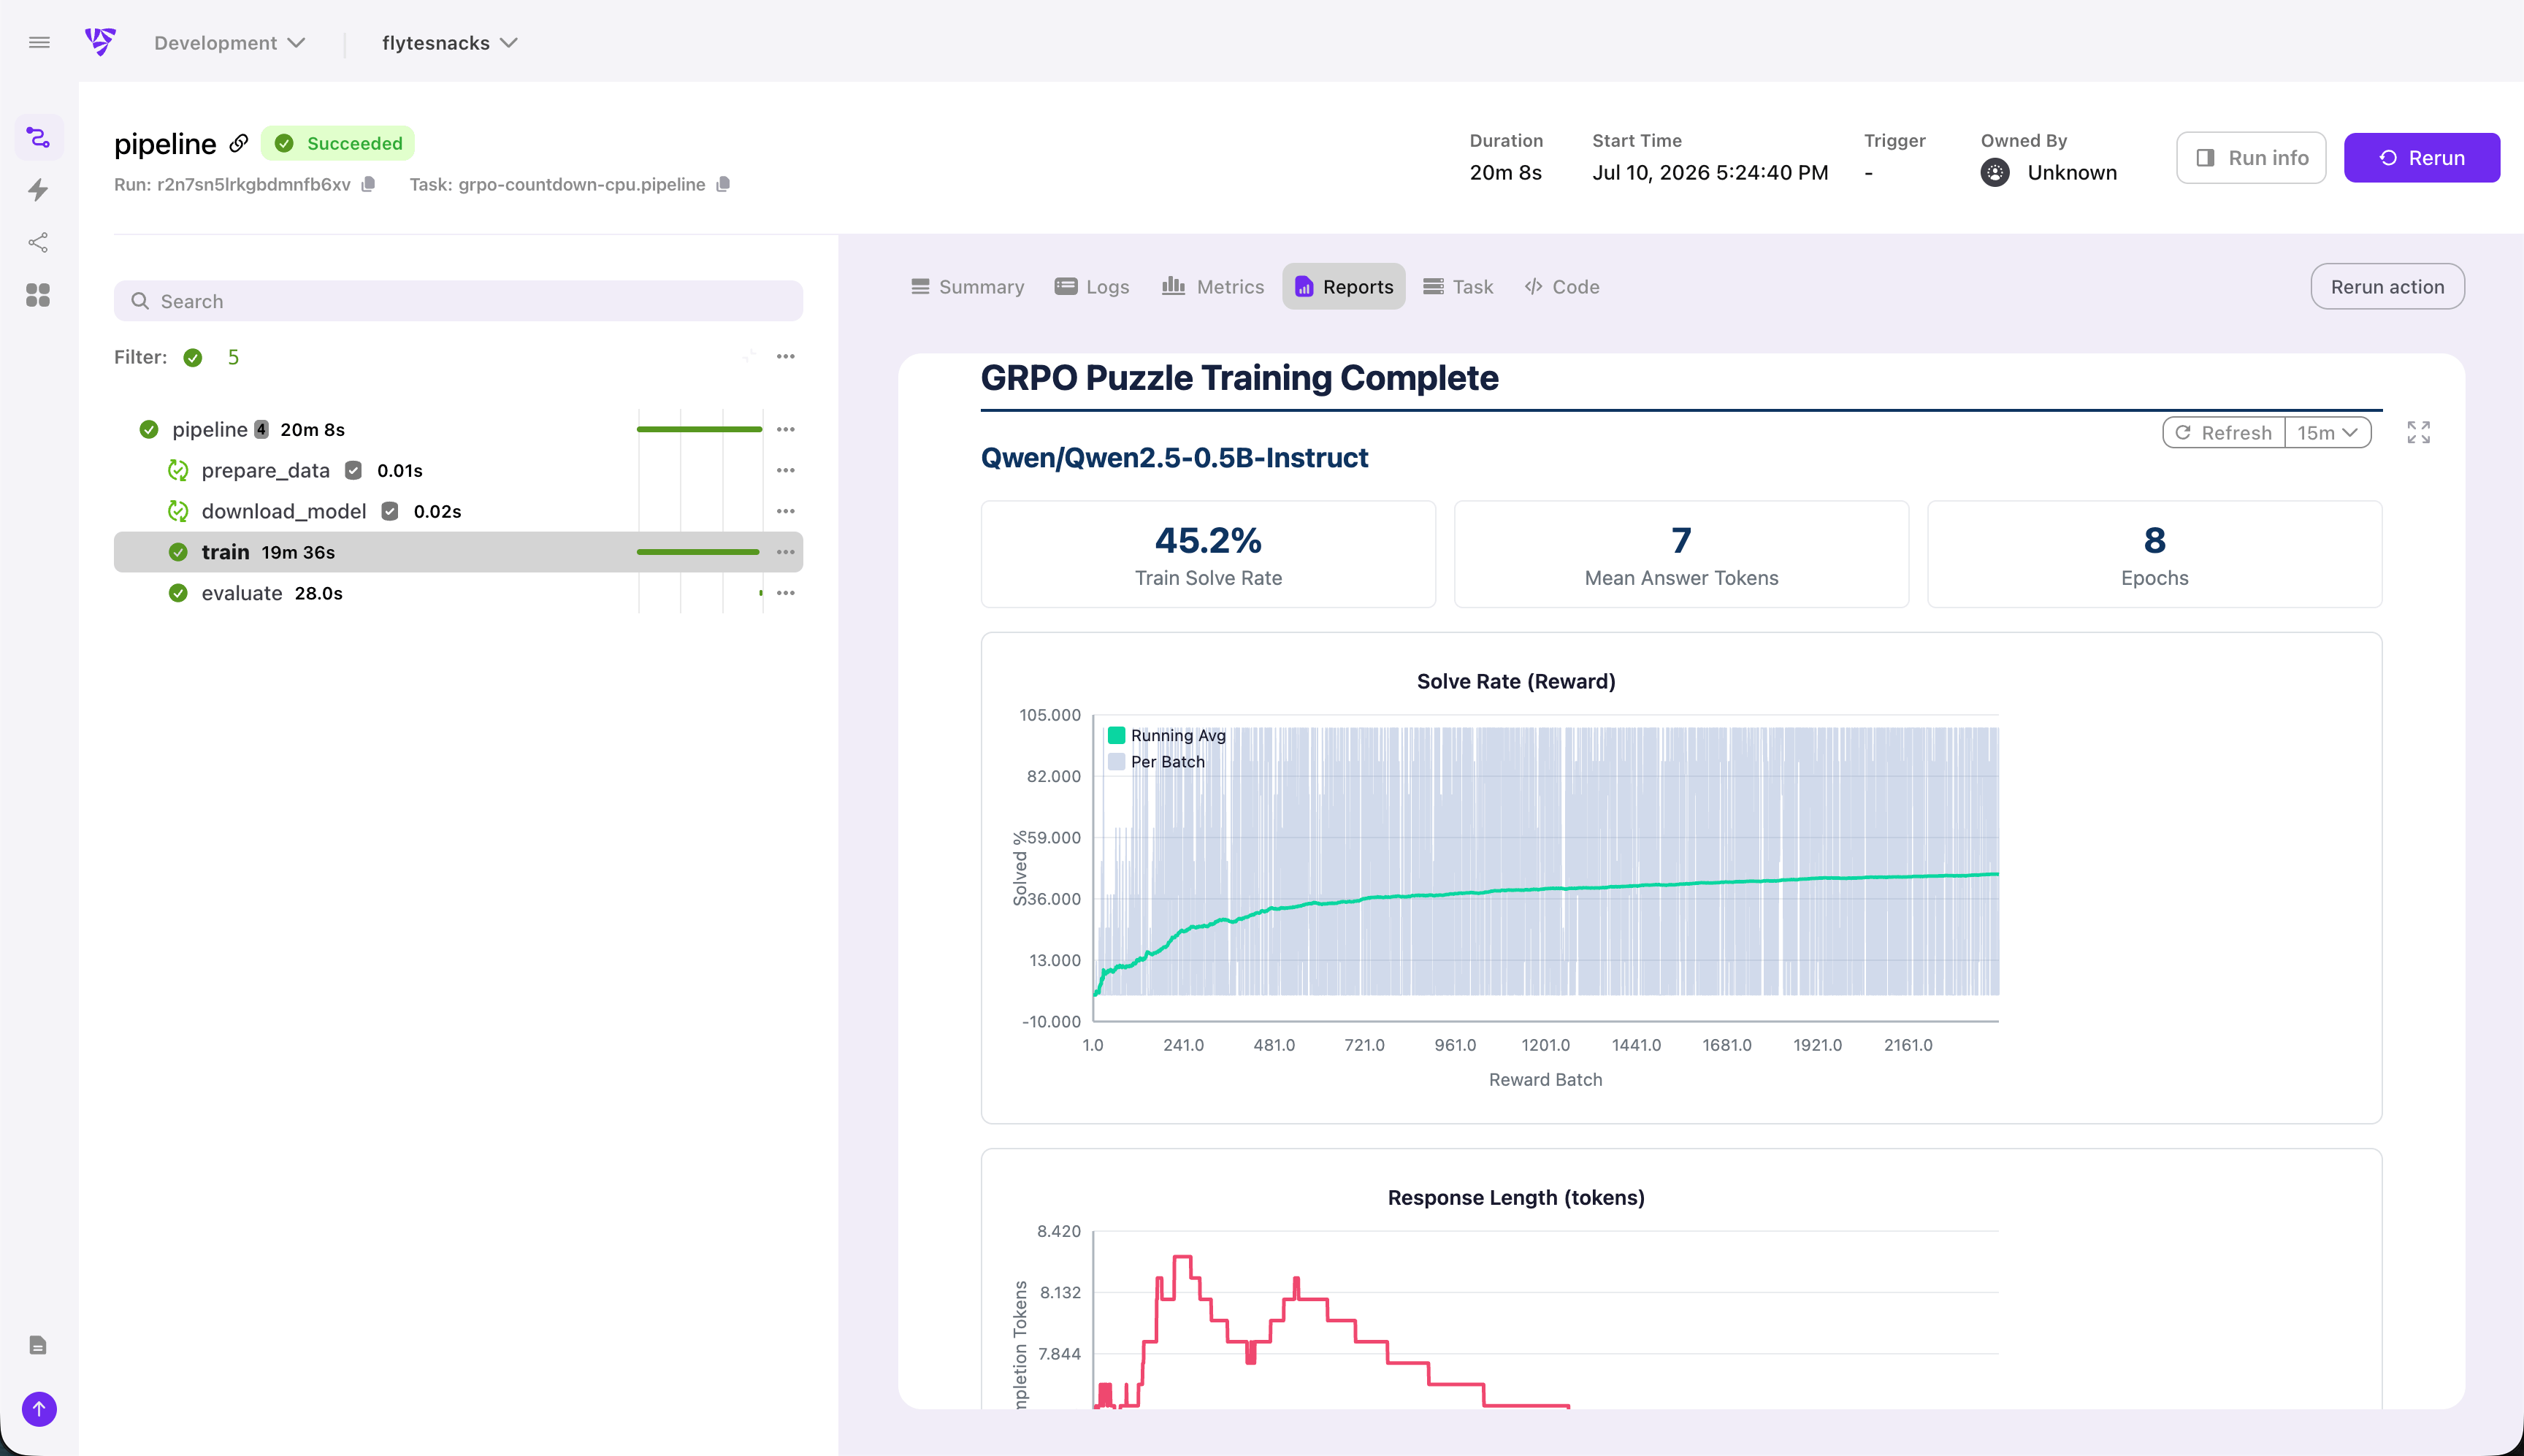
Most orchestrators show you logs and a return value. Flyte lets you render full HTML reports - charts, tables, interactive dashboards -right in the UI alongside your task. No separate dashboard tool needed.
Add report=True to your task, then use flyte.report to push HTML content. It shows up as a tab in the Flyte console while (or after) your task runs.
Render a matplotlib chart
import flyte
import flyte.report

env = flyte.TaskEnvironment(
    name="reporting",
    image=flyte.Image.from_debian_base().with_pip_packages("matplotlib", "pandas"),
)

@env.task(report=True)
async def training_report(epochs: int) -> float:
    import base64, io
    import matplotlib
    matplotlib.use("Agg")
    import matplotlib.pyplot as plt

    # Simulate training metrics
    losses = [1.0 / (i + 1) + 0.05 * i % 3 for i in range(epochs)]

    # Create the chart
    fig, ax = plt.subplots(figsize=(8, 4))
    ax.plot(losses, color="#7652a2", linewidth=2)
    ax.set_title("Training Loss")
    ax.set_xlabel("Epoch")
    ax.set_ylabel("Loss")

    # Convert to embeddable HTML
    buf = io.BytesIO()
    fig.savefig(buf, format="png", bbox_inches="tight", dpi=120)
    buf.seek(0)
    b64 = base64.b64encode(buf.read()).decode()
    plt.close(fig)

    await flyte.report.log.aio(
        f'<h2>Training Report</h2><img src="data:image/png;base64,{b64}" />',
        do_flush=True,
    )
    return losses[-1]
When this task runs, the chart appears directly in the Flyte UI. No S3 links to click, no separate notebook to open.
Render HTML or Markdown
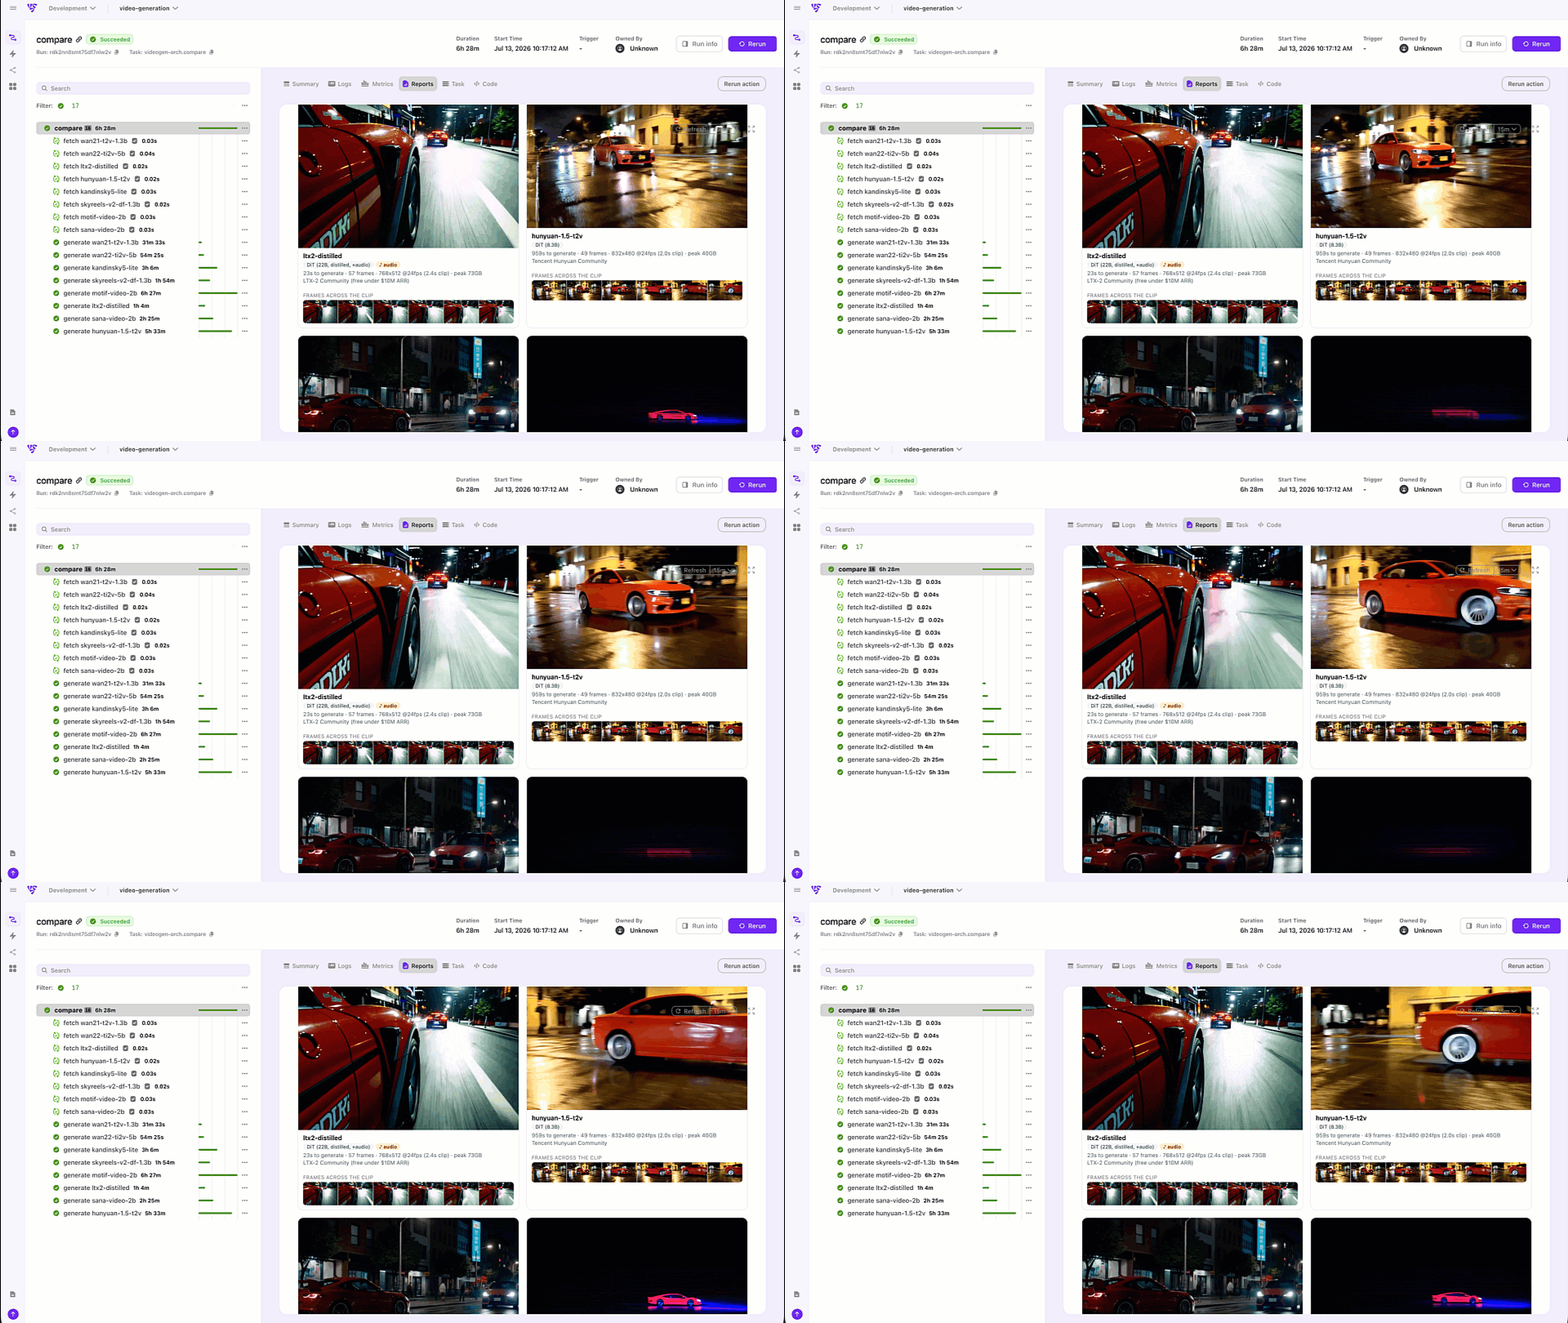
You can embed complex reports like snippets from video generation or physical AI simulation rollouts from headless environments directly in reports so you don’t have to download artifacts to see how your models are performing.
Use tabs to organize output
Got multiple things to show? Use tabs:
@env.task(report=True)
async def evaluation_report():
    # Tab 1: metrics table
    metrics_tab = flyte.report.get_tab("Metrics")
    metrics_tab.log("<table><tr><th>Model</th><th>Accuracy</th></tr>"
                    "<tr><td>v1</td><td>0.92</td></tr>"
                    "<tr><td>v2</td><td>0.95</td></tr></table>")

    # Tab 2: chart
    charts_tab = flyte.report.get_tab("Charts")
    charts_tab.log("<p>Chart goes here...</p>")

    await flyte.report.flush.aio()
Each tab shows up as a clickable section in the report view.
Stream updates in real time
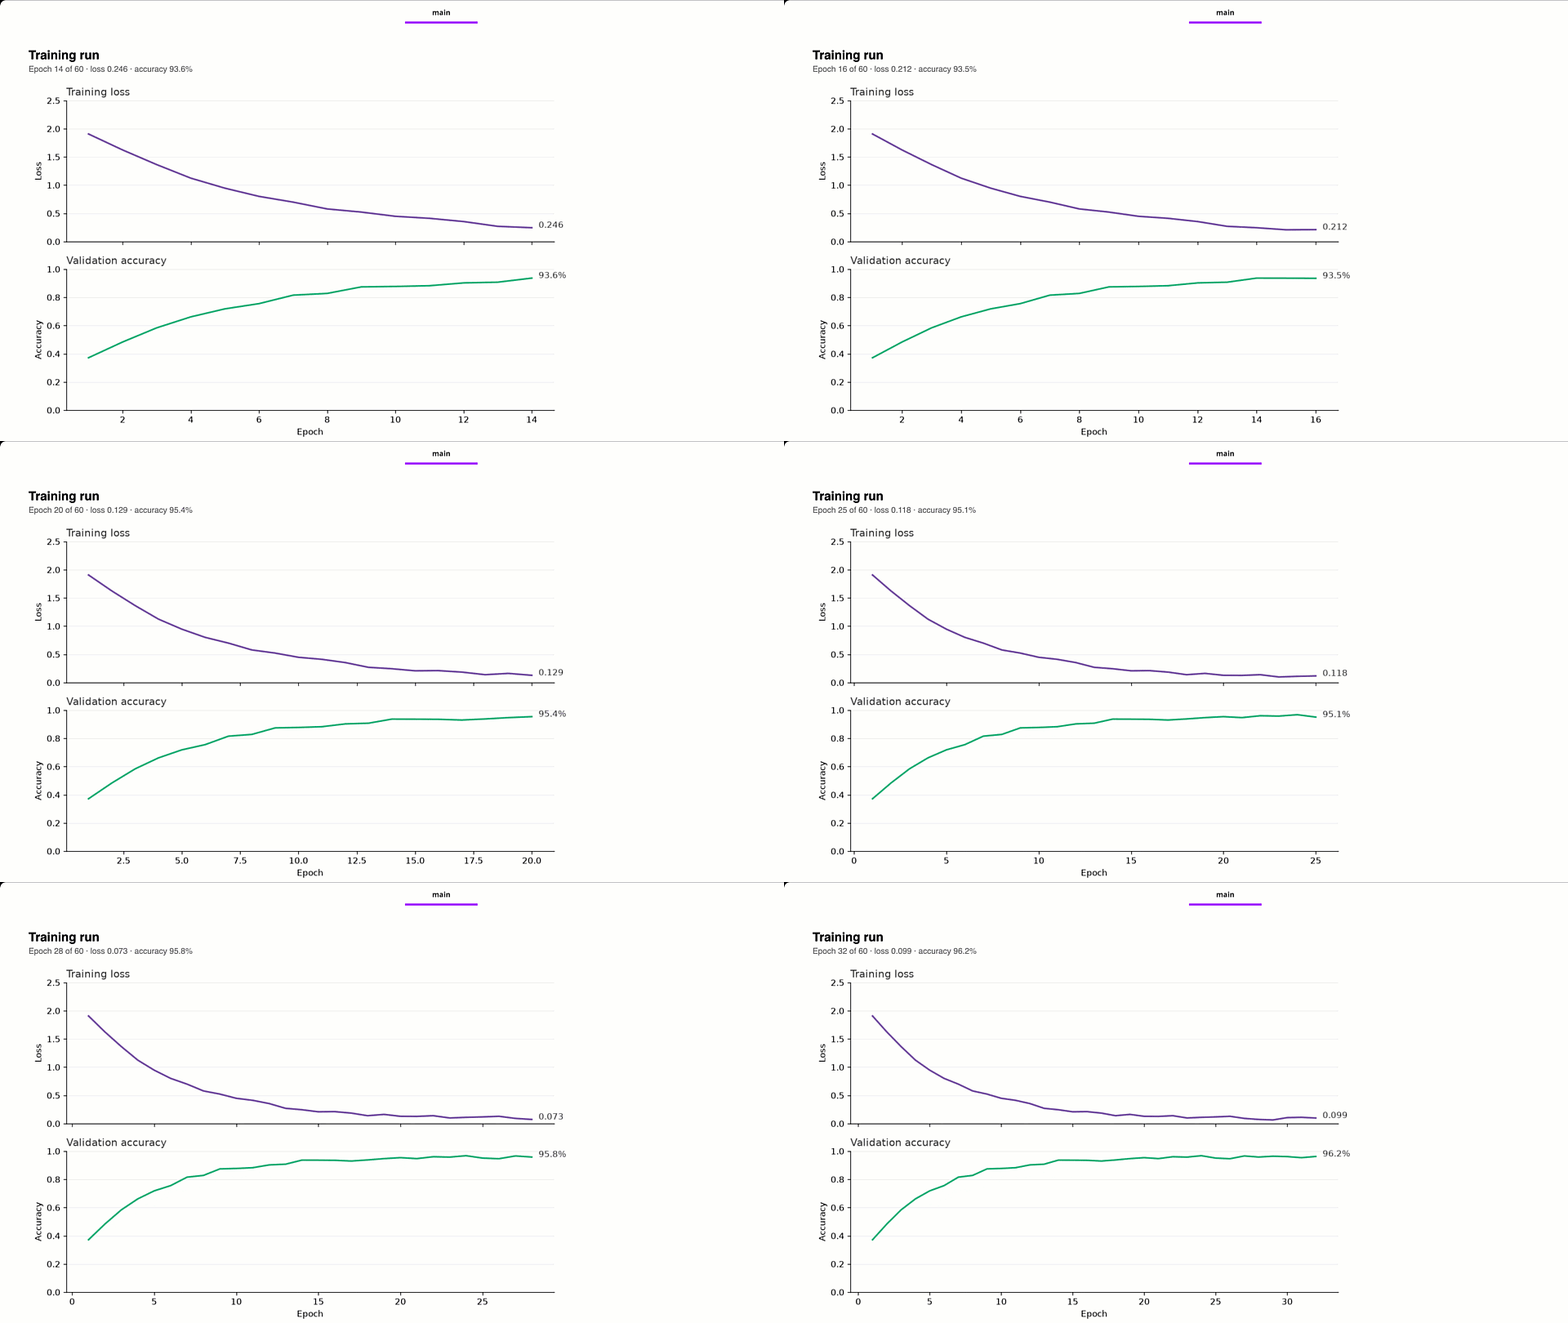
Reports aren’t just static, you can stream updates as your task runs for realtime monitoring of training runs
import asyncio

@env.task(report=True)
async def streaming_progress(total_steps: int) -> str:
    for step in range(1, total_steps + 1):
        progress = step / total_steps * 100
        await flyte.report.log.aio(
            f"<p>Step {step}/{total_steps} -{progress:.0f}% complete</p>",
            do_flush=True,
        )
        await asyncio.sleep(1)

    await flyte.report.log.aio(
        '<div style="background:#d4edda;padding:15px;border-radius:5px;">'
        '<h3>Done!</h3></div>',
        do_flush=True,
    )
    return "complete"
The report updates live in the UI as each step finishes. Great for long-running training jobs where you want to watch progress without tailing logs.
Render DataFrames as styled tables
@env.task(report=True)
async def data_summary():
    import pandas as pd

    df = pd.DataFrame({
        "model": ["bert-base", "distilbert", "roberta"],
        "f1": [0.91, 0.88, 0.93],
        "latency_ms": [45, 22, 52],
    })

    tab = flyte.report.get_tab("Results")
    tab.log(df.to_html(index=False, border=0, classes="dataframe"))
    await flyte.report.flush.aio()
Why reports are useful
Quick feedback loops: See charts and tables without leaving the Flyte UI.
Experimentation management: Since every run is versioned you can click in to see training and eval reports per task execution
Shareable: Anyone with access to the Flyte console can view the report -no notebook setup needed.
Streaming: Watch training curves update in real time.
Full HTML: Anything you can render in HTML works - D3.js, Chart.js, Three.js, plain tables.
Read more in the flyte docs: https://www.union.ai/docs/v2/flyte/user-guide/task-programming/reports/
See what’s happening in the Flyte Community:
📝 Latest from the blog
Batch Inference at Scale: How to Maximize GPU Utilization - Read on Union.ai
From Billions to Bytes: The Science of Shrinking Neural Networks - Read on Union.ai
Container-enabled asyncio is all you need (to build Pythonic AI workflows at scale) - Read on Union.ai
Flyte MCP: give your local coding agent control-plane superpowers - Read on Union.ai
🎥 Recent talks & recordings
Building Code Mode Agents - Watch on YouTube
LLM fine-tuning with GRPO - Watch on YouTube
LLM fine-tuning with LoRA & QLoRA - Watch on YouTube
📅 Upcoming events
July 15th: Seattle AI, ML, and Computer Vision Meetup at Union HQ - RSVP on Voxel51
July 23rd: Seattle Agent Loop Hacknight: Build Agents with Flyte - RSVP on Luma
July 28th: Seattle TwelveLabs + Qdrant: AI Systems for Video Embeddings and Search - RSVP on Luma
🛠️ Releases & updates
Flyte 2 OSS: Backend Devbox and Reimagined UI - Read on Union
June’s release brought first-class agents with memory and tool approval, SDK-authored MCP servers, backoff retries and per-attempt timeouts, multi-pod log streaming, and beta queues and events APIs. - Read the Release notes
🤝 From the community
July 15th: Seattle AI, ML, and Computer Vision Meetup - RSVP on Voxel51
AI Book Club: RAG with Python Cookbook - RSVP on Luma
That’s all for this week! - Sage Elliott