
See Inside Your AI Tasks: Function-Level Visibility with Traces
A weekly roundup of tips, releases, and community news from the flyte.org & union.ai ecosystem.

🚀 Get started with Flyte: docs.flyte.org
💬 Join the community: Slack
🛠️ Make a Contribution: GitHub
📅 Next Event: LLM fine-tuning with GRPO
Hello everyone. I’m going to keep a variation of this intro in the first few posts. Just quick reminder of why this landed in your inbox: at some point you opted in to hear from the Union.ai/Flyte team (Likely from one of my events). I’m restarting our newsletter, it will be short, practical AI engineering tips you can actually use. I think it’s going to be. alot of fun, but if it turns out this isn’t for you, no hard feelings, you can always unsubscribe. - Sage Elliott
💡 AI engineering tip of the week: See Inside Your Tasks: Function Level Visibility with Traces
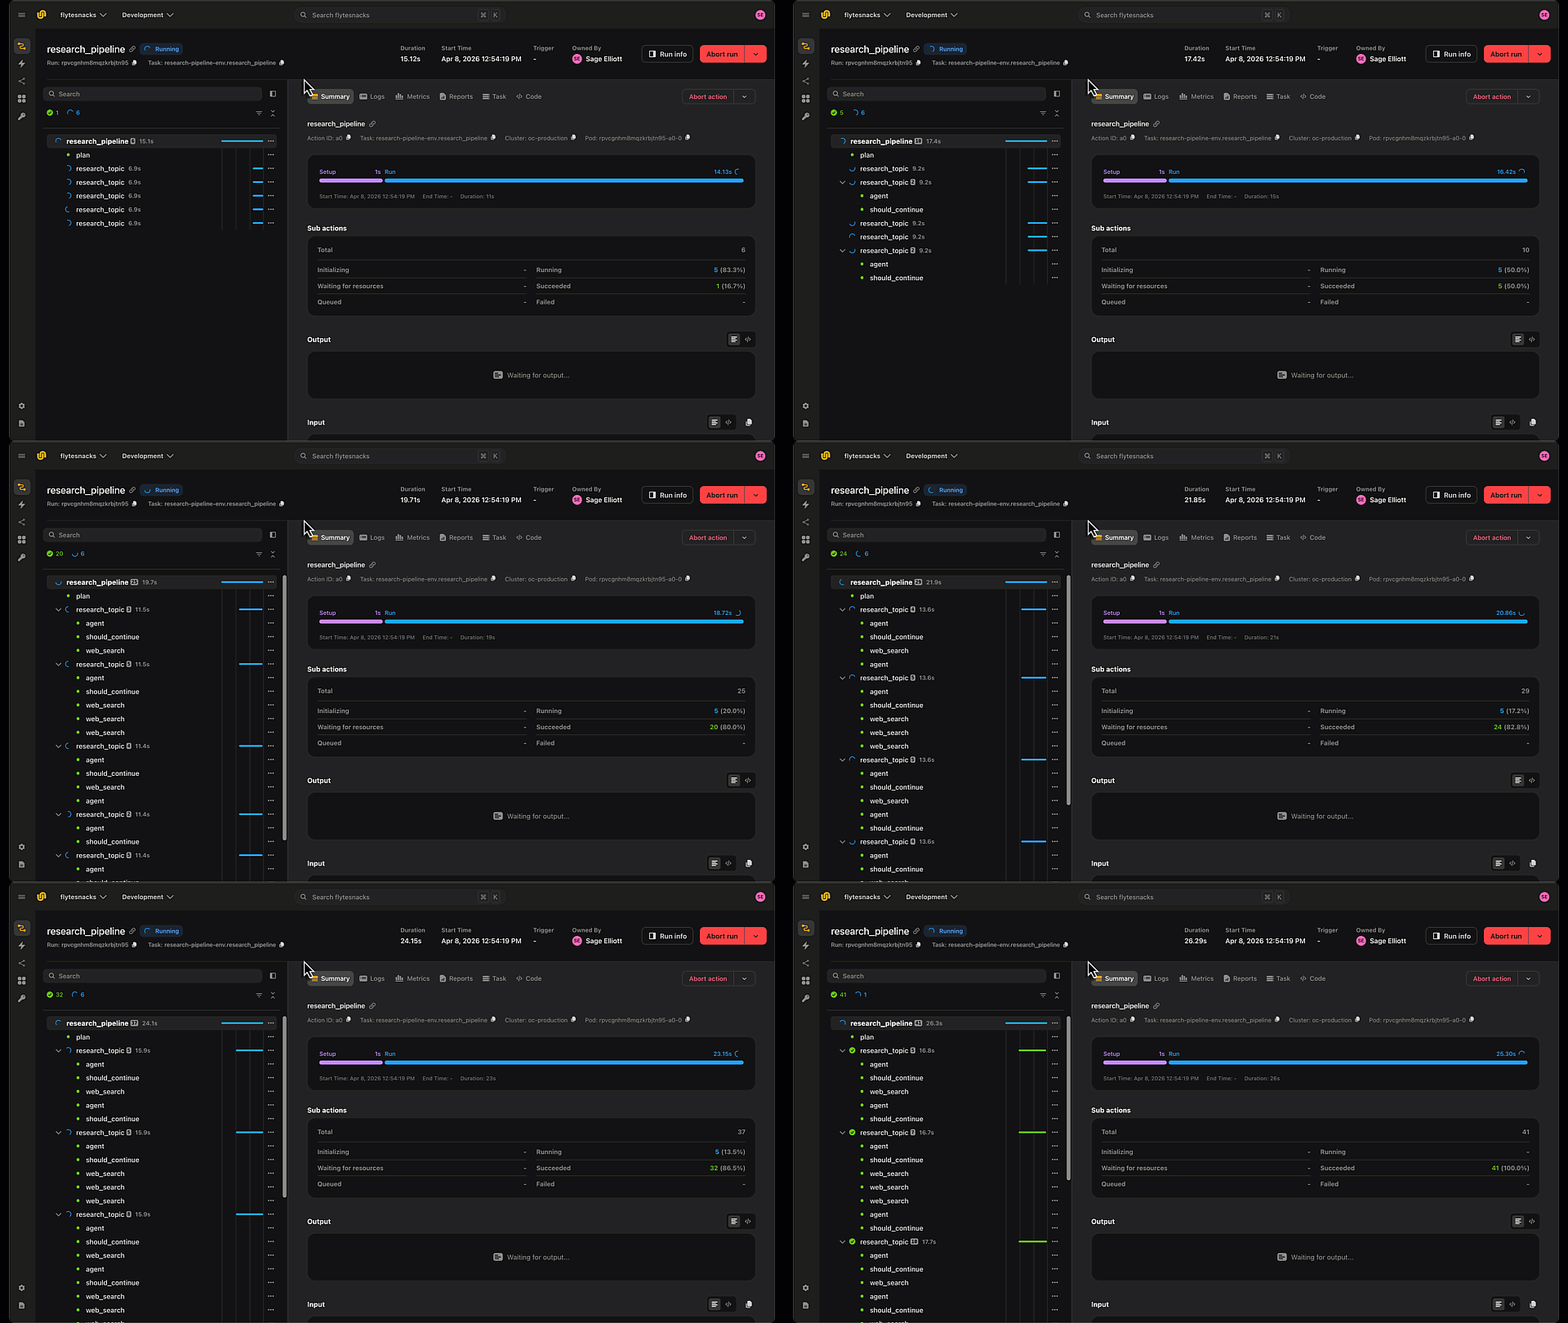
Flyte already logs the inputs and outputs of every task. But a task is often a black box -inside it might be three LLM calls, a couple of tool invocations, and some glue code, and when something goes wrong you only see what went in and what came out, not what happened in between.
Flyte’s @flyte.trace decorator opens that box. Wrap any helper function a task calls and Flyte records each call as its own span in the UI -with its inputs, outputs, and execution time captured. You go from task-level logging to function-level visibility, without leaving your Python code or wiring up a separate observability stack.
How it works
import flyte

env = flyte.TaskEnvironment(name="trace_demo")

@flyte.trace
async def call_llm(prompt: str) -> str:
    # Each call shows up in the UI with its prompt in and response out.
    response = await llm_client.chat(prompt)
    return response

@env.task
async def summarize(documents: list[str]) -> list[str]:
    summaries = []
    for doc in documents:
        summary = await call_llm(f"Summarize: {doc}")
        summaries.append(summary)
    return summaries
The task is already logged end to end. Adding @flyte.trace to call_llm means every individual prompt and response inside that loop is logged too -so you can click into the run and see exactly what the model received and returned on each iteration.
Why this matters for agents
Tool-calling agents are the perfect use case. An agent task runs a loop -the model reasons, picks a tool, the tool runs, the model observes the result, and it repeats. From the outside, all you see is the goal in and the final answer out. Trace the pieces and the whole loop becomes inspectable:
@flyte.trace
async def reason(state: str) -> str:
    # The LLM's reasoning step -prompt and decision captured.
    return await llm_client.chat(state)

@flyte.trace
async def act(tool: str, args: dict) -> str:
    # The tool call -arguments in, tool result out.
    return await TOOLS[tool](**args)

@env.task
async def agent(goal: str) -> str:
    state = goal
    for _ in range(MAX_STEPS):
        decision = await reason(state)
        if is_final(decision):
            return decision
        result = await act(*parse(decision))
        state = f"{state}\nObservation: {result}"
    return state
Now every LLM call and every tool invocation is its own span. When an agent gives a wrong answer, you can see which step went sideways -a bad reasoning hop, a tool that returned garbage, or a malformed argument -instead of guessing from the final output.
A nice bonus: resume from where you left off
Because each successful traced call is recorded, traces double as checkpoints. Pair a task with retries=N and a failed task resumes from the last successful trace instead of starting over:
@flyte.trace
async def run_inference(item: str) -> str:
    await asyncio.sleep(1)  # expensive model call
    return f"prediction for {item}"

@env.task(retries=3)
async def batch_predict(inputs: list[str]) -> list[str]:
    return [await run_inference(i) for i in inputs]
If this OOMs at input 400 of 500, the retry replays the first 400 from their checkpoints and picks up at 400 -no wasted GPU time or API spend. Visibility first, free crash recovery second.
Key things to know
Every traced call captures inputs, outputs, and execution time - visible as a span in the Flyte UI.
Only successful trace executions are recorded; failed calls propagate exceptions to your task for normal error handling.
Successful traces also act as checkpoints, combine with
retries=Nfor automatic resume-from-failure.Traces are for helper functions your tasks call, not for nested tasks.
Use
flyte.group("name")to organize related traces visually in the UI.
Full traces docs: union.ai/docs/v2/union/user-guide/task-programming/traces
See what’s happening in the Flyte Community:
📝 Latest from the blog
Flyte MCP: give your local coding agent control-plane superpowers - Read on Union.ai
Long horizon Agents on a Durable AI Runtime - Read on Union.ai
Breach! How AI stacks are compromising data security - Read on Union.ai
🎥 Recent talks & recordings
Workshop Recording: Build Research Agents That Don’t Break: LangGraph + Flyte - Watch on YouTube
LLM fine-tuning with LoRA & QLoRA - Watch on YouTube
Fine-Tuning BERT for the Unstructured Data You Actually Have - Watch on YouTube
📅 Upcoming events
July 9th: LLM fine-tuning with GRPO - RSVP on Luma
July 14th: Building Code Mode Agents - RSVP on Luma
July 15th: Seattle AI, ML, and Computer Vision Meetup at Union HQ - RSVP on Voxel51
July 28th: Seattle TwelveLabs + Qdrant: AI Systems for Video Embeddings and Search - RSVP on Luma
🛠️ Releases & updates
Flyte 2 OSS: Backend Devbox and Reimagined UI - Read on Union
June’s release brought first-class agents with memory and tool approval, SDK-authored MCP servers, backoff retries and per-attempt timeouts, multi-pod log streaming, and beta queues and events APIs. - Read the Release notes
🤝 From the community
July 15th: Seattle AI, ML, and Computer Vision Meetup - RSVP on Voxel51
AI Book Club: Agentic Architectural Patterns for Building Multi-Agent Systems - RSVP on Luma
That’s all for this week! - Sage Elliott
 | A guest post by
|